

What are OKRs and How to Get the Cadence Right
14 Jul 2026
The evolution from SaaS to SaS
28 Jul 2026This article is an excerpt from the book “Digital Transformation and Product Culture: How to Put Technology at the Center of Your Company’s Strategy”.
During the period when India was a British colony, the British government, concerned about accidental deaths from venomous snake bites, decided to offer a reward for each person who appeared with a dead snake. For some time, this program worked, and an increasing number of dead snakes started appearing for the government to pay the reward. However, the number of accidental deaths from snakebites continued to grow. When the government investigated what was happening, they discovered that some people had started breeding snakes at home to later kill them and claim the government’s reward.
This is the concept of a perverse metric, a metric that, when used in isolation, can lead to undesired and unexpected behaviors. This is why we should have more than one KR (Key Result) per objective. If we have a single KR per objective, there is a risk of having this perverse metric behavior.
Let’s assume a customer service team has the objective of “increasing the productivity of our customer service team” and sets a single KR, which is “reduce AHT from 10 min to 2 min.” AHT is the Average Handling Time. By reducing AHT, it’s possible to handle more customers with the same team, thus increasing productivity. The customer service team might start cutting calls at the 2-minute mark, regardless of whether the issue is resolved. In such a case, we need other KRs to ensure problem resolution and customer satisfaction.
Leading (cause) and lagging (effect) metrics
There is a way to classify metrics that helps a lot in understanding the potential impact of the metric. In English, the terms used are “leading” and “lagging.” They can be understood as cause metrics and effect metrics. While churn and NPS are effect metrics, engagement can be seen as a cause metric.
To explain what leading and lagging indicators are and the difference between cause indicators (leading) and effect indicators (lagging), let me share a story about the work we did both at Locaweb and Conta Azul to discover ways to predict churn. Which customers were more likely to cancel the subscribed service? We conducted several analyses to find behaviors that indicated, with higher accuracy, whether a customer would cancel, and we discovered several interesting behaviors. For example, a web hosting customer who redirects their domain to point to a site hosted elsewhere likely did so because they are changing hosting services. Or if a website experiences a significant drop in traffic, there is a good chance the customer will cancel the web hosting service. Similarly, if a Conta Azul customer, who used to register 50 sales per month, reduces the number of registered sales to zero, there’s a high chance that this customer will cancel their Conta Azul account.
Churn is an example of an effect indicator because it tells us what happened – customers canceled. Effect indicators are metrics that help us evaluate the result of a company or an initiative. Examples of effect indicators include churn, revenue, profit, number of customers, and NPS. These metrics should be monitored frequently, in some cases even daily or more than once a day, but they are the consequence. They show the result but do not show how that result was achieved.
To understand how a result was achieved, we should use cause indicators. In the previous example of churn and the investigation of factors that help predict it, the detected customer behavior as a predictor of churn was the quantity of site visits and the number of registered sales, which are cause indicators. This type of indicator helps predict a result, predicting how an effect indicator will behave. We should focus our energy on cause indicators to see the pointer of the effect indicator move.
For example, what should we do to reduce the churn of a product? Ensure that the product is being used and is useful, meaning it is solving a problem or meeting a user’s need. In Locaweb, for the web hosting product, the site must be useful to the site owner. What does this site owner or e-commerce owner expect from this site? Visits? Customers? Purchases? How can we help the site owner achieve their goal? That is the path to avoid churn. In Conta Azul, what is the expected behavior of a customer who is solving their management problems using the product? How often do they log in per week? What do they do when they log into the system? How can we help the customer make the most out of the product?
Whenever I see product teams setting churn or even NPS goals, which are effect metrics, I recommend including engagement goals and not setting churn and NPS as goals but as metrics to be monitored. If you have a product that generates engagement within what you had planned for that product, you will likely have low churn and a good NPS.
Here are some examples of effect metrics and possible cause metrics in the table below:
| Lagging Metric (Effect) | Leading Metric (Cause) |
|---|---|
| Reduction in accidents | Use of safety equipment |
| Weight loss | Reduced calorie intake |
| Decrease in cancellation requests | Customer actively using the product |
When applying OKRs, one way to use cause and effect indicators is to define effect indicators as objectives and cause indicators as key results. Alternatively, we can maintain effect metrics as key results, but we should try to have some key results with cause metrics as well.
Using the example of the OKR to be healthier, losing 3 kilograms is the expected effect, just as reducing body fat by 5% is an effect metric. On the other hand, exercising three times a week is a cause metric. Since we have only one cause metric, it might be interesting to include other cause metrics, such as not eating sweets and limiting daily calorie intake, to help us achieve the goal of being healthier.
Digital transformation and product culture
This article is another excerpt from my newest book “Digital transformation and product culture: How to put technology at the center of your company’s strategy“, which I will also make available here on the blog. So far, I have already published here:
- About the book
- Part 1: Concepts
- Chapter 1: The so-called digital transformation – Project and Product
- Chapter 2: Uncertainty and digital transformation
- Chapter 3: Types of company
- Chapter 4: Type of company vs digital maturity
- Chapter 5: Business models
- Chapter 6: Agile, digital and product culture
- Part 2: Principles
- Chapter 7: Deliver early and often – Measuring and managing the productivity – Case study: Dasa Group – Case study: Itaú Unibanco
- Chapter 8: Focus on the problem – The Famous Product Discovery – Why the “business demands => IT implements” model does not work – Case study: Magazine Luiza
- Chapter 9: Result delivery – Outsource or internal team? – Case study: Centauro
- Chapter 10: Ecosystem mindset
- Part 3: Tools
- Chapter 11: Product Vision – Product vision examples
- Chapter 12: Product Strategy
- Chapter 13: Team Structure – Structuring effective product development teams – Structural teams – Team structure spreadsheet – Downsizing and layoffs – CTO + CPO – Internationalization – Outsourced team – Tuckman model – Dependencies between teams – Should we have a dedicated innovation team? – Should we have a team dedicated to fixing bugs? – Business Units – Why Individual Bonuses Don’t Work in Product Teams – What makes a group of people behave like a team?
- Chapter 14: What are OKRs and How to Get the Cadence Right – Perverse Metrics, Leading Metrics, and Lagging Metrics
Scale your customer research
In a world where AI levels the playing field, deep customer knowledge is the one asset your competitors can’t copy. ReveLumi was built exactly for that. Learn more at revelumi.com.
Workshops, coaching, and advisory services
I’ve been helping companies and their leaders (CPOs, heads of product, CTOs, CEOs, tech founders, and heads of digital transformation) bridge the gap between business and technology through workshops, coaching, and advisory services on product management and digital transformation.
Gyaco Podcasts
At Gyaco, we believe in the power of conversations to spark reflection and learning. That’s why we’ve created “Produto em Pauta” podcast, with new episodes every Thursday.
The main series is called Mentorias: coaching conversations with product professionals, built on the idea that one person’s questions are often the questions of many others. We explore concrete challenges and turn experience into practical insights you can apply in your own context.
Available on YouTube and Spotify. Recorded in Portuguese, with English subtitles on YouTube.
Digital Product Management Books
Do you work with digital products? Do you want to know more about managing a digital product to increase its chances of success, solve its user’s problems, and achieve the company objectives? Check out my Digital Product Management books, where I share what I learned during my 30+ years of experience in creating and managing digital products:
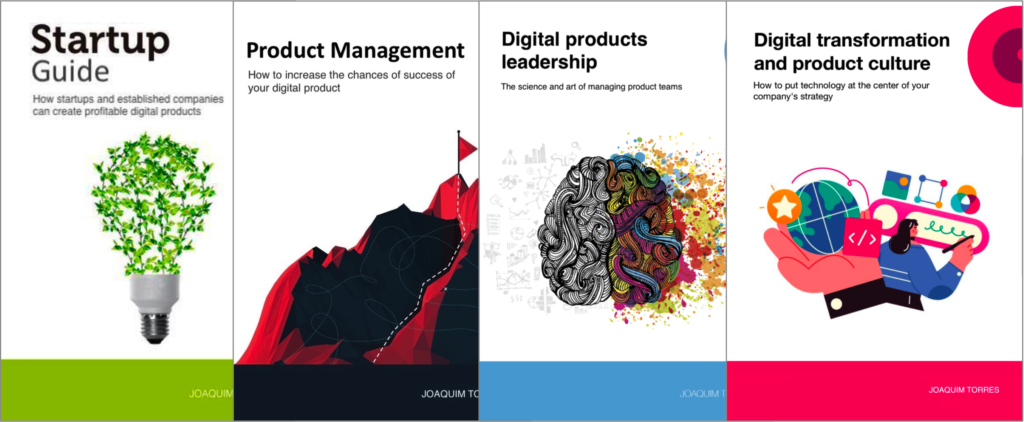
- Digital transformation and product culture: How to put technology at the center of your company’s strategy
- Leading Product Development: The art and science of managing product teams
- Product Management: How to increase the chances of success of your digital product
- Startup Guide: How startups and established companies can create profitable digital products